4 Written questions
4.1 Question 1
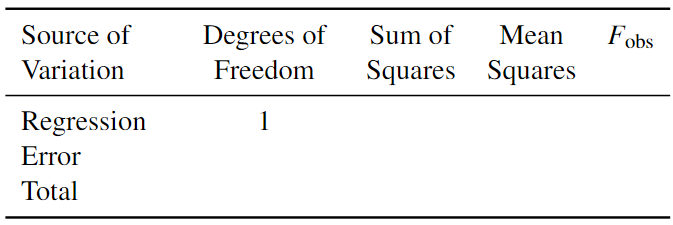
Given the following summary statistics
\[\sum_{i=1}^{20} \left(Y_i - \hat{Y}_i\right)^2 = 6.94983 \quad\quad \sum_{i=1}^{20} \left(Y_i - \bar{Y}\right)^2 = 13.09869,\]
complete the analysis of variance table below.
4.2 Question 2
The following linear model was fitted to some data:
\[\mathbb{E}(Y_i) = \beta_0 + \beta_1 x_i, \quad i = 1,\ldots, 50.\]
The output and some summary statistics from the data are given below:
##
## Call:
## lm(formula = y ~ x)
##
## Residuals:
##      Min       1Q   Median       3Q      Max
## -0.52476 -0.16286  0.02166  0.13833  0.44428
##
## Coefficients:
##             Estimate Std. Error t value Pr(>|t|)
## (Intercept)   2.6390     0.3100   8.513 3.74e-11 ***
## x             0.6905     0.0899   7.681 6.71e-10 ***
## ---
## Signif. codes:  0 '***' 0.001 '**' 0.01 '*' 0.05 '.' 0.1 ' ' 1
##
## Residual standard error: 0.2385 on 48 degrees of freedom
## Multiple R-squared:  0.5514, Adjusted R-squared:  0.542
## F-statistic: 58.99 on 1 and 48 DF,  p-value: 6.71e-10
## Analysis of Variance Table
##
## Response: y
## Df Sum Sq Mean Sq F value Pr(>F)
## x 1 3.3569 3.3569 58.994 6.71e-10 ***
## Residuals 48 2.7313 0.0569
## ---
## Signif. codes: 0 '***' 0.001 '**' 0.01 '*' 0.05 '.' 0.1 ' ' 1\[ \bar{x} = 3.4280 \quad\quad \bar{y} = 5.0060\] \[\sum_{i=1}^{50} (x_i - \bar{x})^2 = 7.0408 \quad\quad \sum_{i=1}^{50} (y_i - \bar{y})^2 = 6.0882 \quad\quad \sum_{i=1}^{50} (x_i - \bar{x})(y_i - \bar{y}) = 4.8616\]
a. Use the summary statistics to obtain the estimated parameters of \(\hat{\beta}_0\) and \(\hat{\beta}_1\).
Check your answers with the column of
Check your answers with the column of
Estimate in R. b. Use the summary statistics to complete the analysis of variance table below,
i.e. finding the degrees of freedom, the regression sum of squares, the error sum of squares,
the mean squared error, and the \(F\)-statistic. Check your answer with the
i.e. finding the degrees of freedom, the regression sum of squares, the error sum of squares,
the mean squared error, and the \(F\)-statistic. Check your answer with the
R output.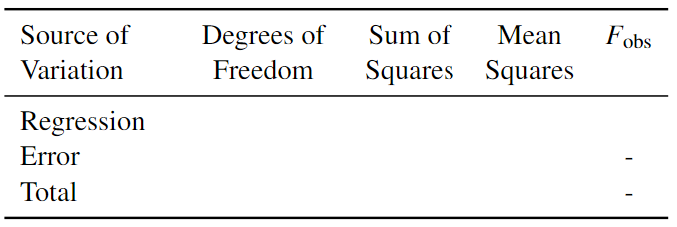
c. What hypotheses are being examined by the \(F\)-statistic in the ANOVA table?
Given that its \(p\)-value \(< 0.05\), what does this tell us about the fitted model?
d. Compute and interpret the coefficient of determination, \(R^2\).
e. Comment on the strength of linear relationship between \(x\) and \(Y\).
Given that its \(p\)-value \(< 0.05\), what does this tell us about the fitted model?
d. Compute and interpret the coefficient of determination, \(R^2\).
e. Comment on the strength of linear relationship between \(x\) and \(Y\).