5 Example 3: Spurious correlation
Hollywood legend Nicholas Cage seems to have a problem. It appears that every time he releases a new film upon the world, many people drown by falling into pools of water. Coincidence? Or, are some of his films that bad?
Data: Cage.csv
Columns:
To access the data, download the file Cage.csv from Moodle and make sure it is saved in an accessible file. The working directory of your RStudio Session should be set to that folder. Once this is done, read in the data using:
5.1 Investigating the relationship with scatterplot
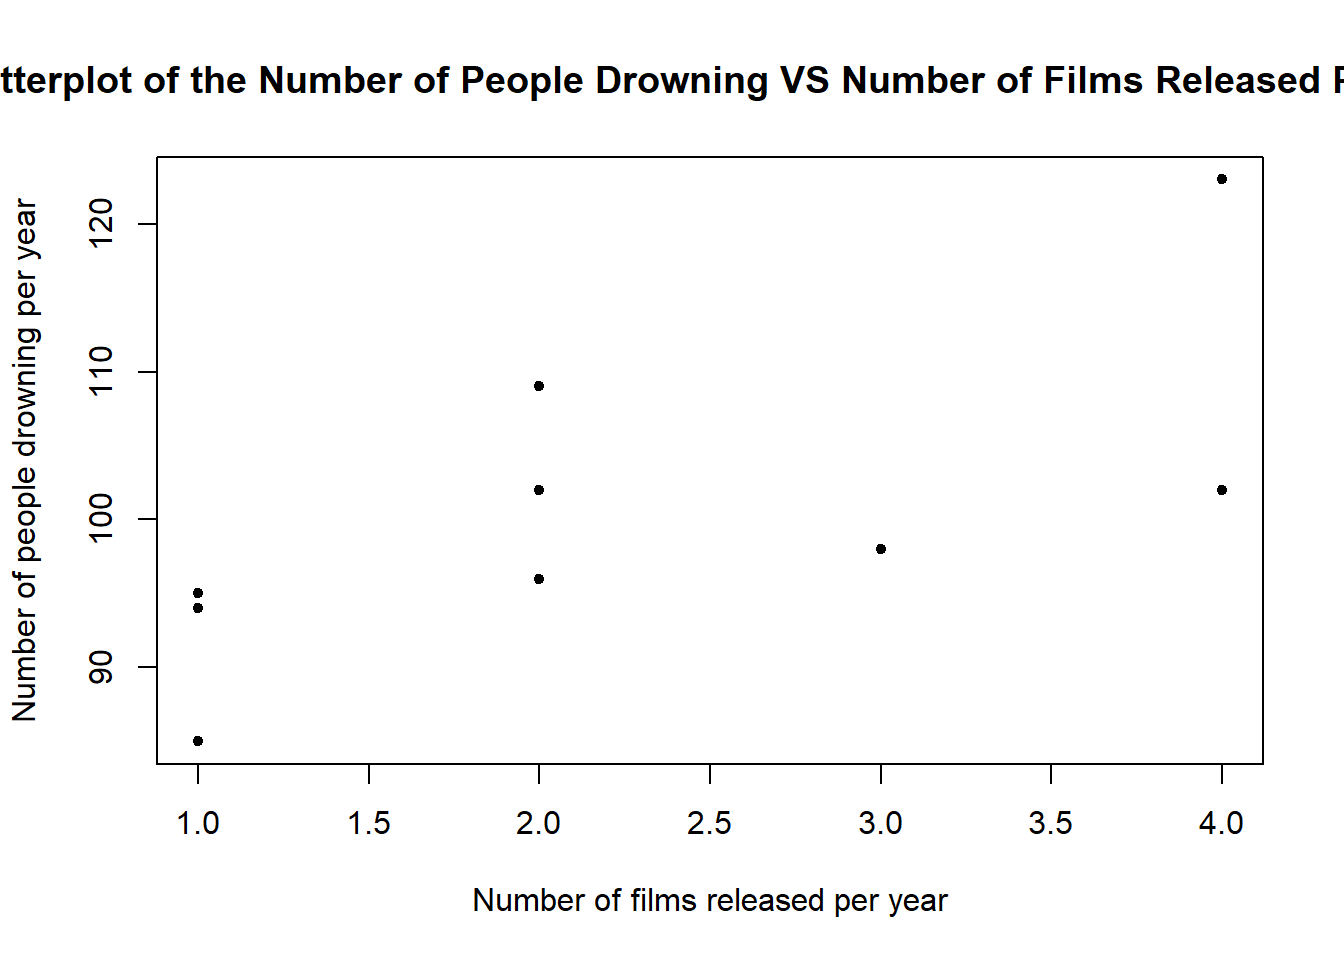
To investigate the relationship between the number of films released in any year against the number of people drowning we should make a scatterplot.
TASK: Produce a scatterplot of NumDrowned against NumFilms with labels and a sensible title.
You can use plot() such as in the previous example with Grades. Or you can refer to previous weeks labs and use ggplot().
5.2 Further analsyis with sample correlation coefficient
## [1] 0.6660043QUESTION: How could we interpret this result?
5.3 Spurious Correlation
Does this mean that Nicolas Cage films are causing drownings? Quite obviously, the answer to this would be no. This is only correlation not causation.
In fact, this is an example of spurious correlation, where two variables that are not related to each other in any way, that is, they are independent, could be inferred as being related. The number of Nicholas Cage films released in a year is clearly not related to the number of drowning accidents in that same year, but if we just take our correlation analysis on face value, then we would think otherwise.
Reference: Spurious Correlations, Tyler Vigen