4 Exercise 2: Quadratic regression
Introducing the data: Publishing history
Source: Tweedie, F. J., Bank, D. A. and McIntyre, B. (1998) Modelling Publishing History, 1475–1640: Change points in the STC.
Context: The Short Title Catalogue (STC) is a list of all the books that were published in Scotland, England and Ireland between 1475 and 1640. We are interested in finding out if there are any changes in the number of books published between 1500 and 1640.
Data: books.csv
Columns:
Year - 1500 – 1640Number of Books - Total number of books publishedRead in the data using:
4.1 Exploratory analysis
TASK 3
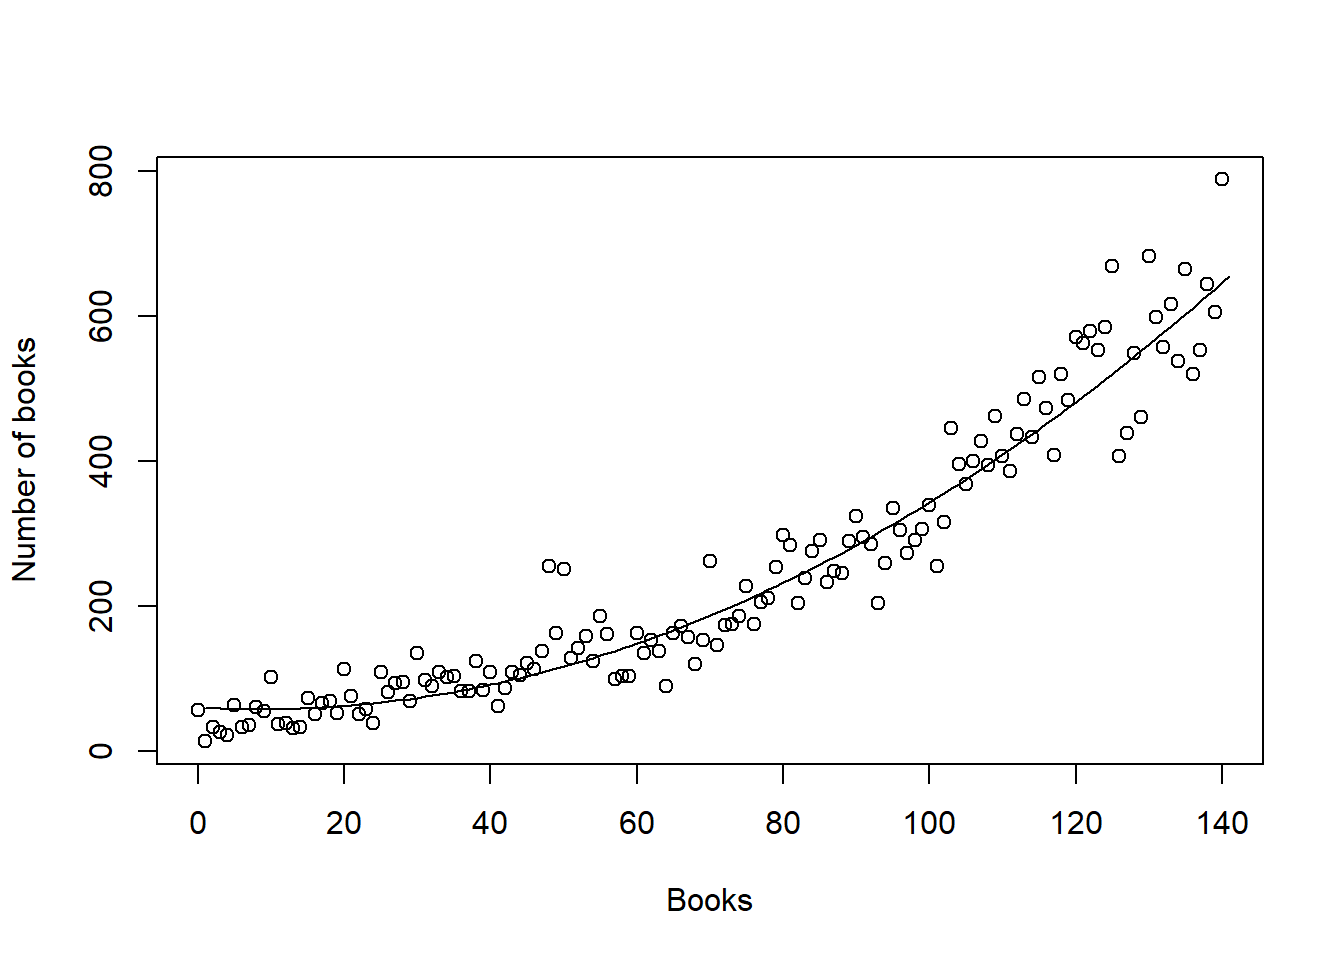
Produce a scatterplot of the data with Number of books on the y-axis and Year on the x-axis.
Describe the shape of the relationship. Does it seem linear?
4.2 Fitting a quadratic regression model
Use the commands below to fit a quadratic regression and output the model summary:
Note: year^2 needs to be 'protected' by I, the identity function.
- Note down the equation of the fitted quadratic line and plot the fitted line.
The R command lines() can be used to plot the points obtained by using fitted() on the model.